
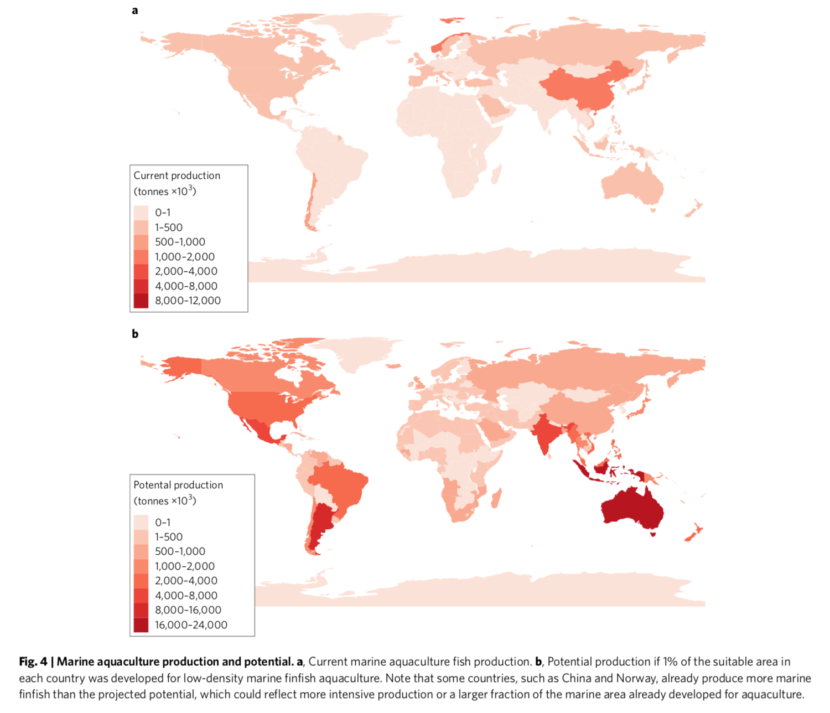
A map of the biological production potential for marine aquaculture across the globe produced using an innovative approach that draws from physiology, allometry and growth theory.
ACCESS
published
yes
availability
public
link
to code here
DESCRIPTORS
type
derived, simulated
gridded
yes
formats
–
TEMPORAL
period
present
coverage
–
resolution
annual
SPATIAL
coverage
global
resolution
0.0083° by 0.0083°
depth
depth integrated

MAJOR VARIABLES
KEY REFERENCES
- Gentry, R. R., Froelich, H. E., Grimm, R., Kareiva, P., Parke, M., Rust, M., Gaines, S.D., Halpern, B. S. (2017). Mapping the global potential for marine aquaculture. Nature Ecology & Evolution, 1(XXX), pp-pp. https://doi.org/10.1038/s41559-017-0257-9.
MORE INFORMATION
- Supplementary Information include spatial distribution of Chl-a, shipping traffic, MPAs, dissolved O2, depth. Additional data include potential growing area for bivalves by country, temperature tolerance and Von Bertalanffy growth parameters for ~180 cultivated species worldwide (120 fish, and 60 bivalves).
- The data that support the findings of this study are available from the sources listed in Supplementary Table 1 of Gentry et al. 2017. All analyses, computer code and data products reported are publicly accessible on the Knowledge Network for Bioclompexity data repository at https://knb.ecoinformatics.org/view/doi:10.5063/F1S180FS.